GPU Operations on an NVIDIA Kubernetes AI Home Lab
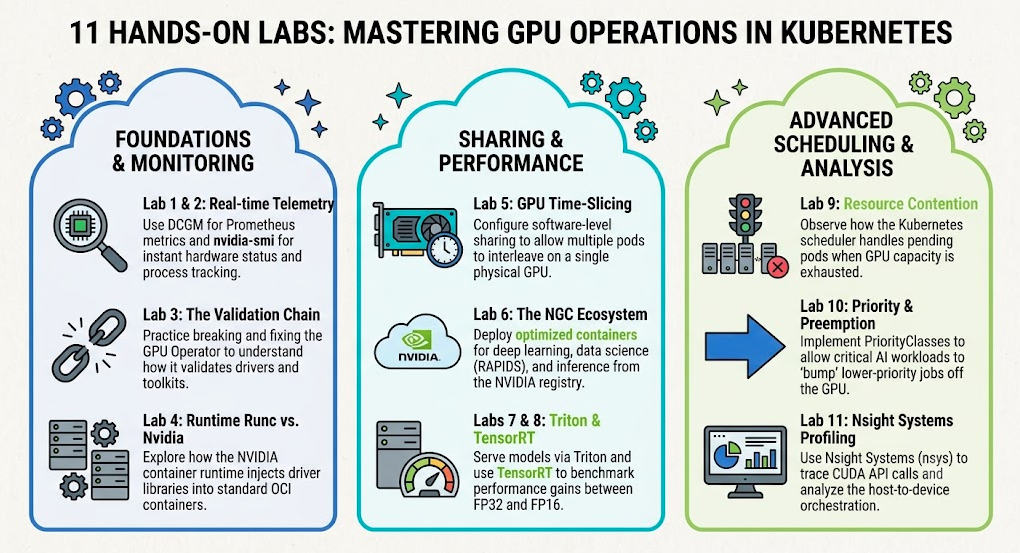
Eleven follow-up labs on the Part 1 cluster - monitoring, sharing, serving, and scheduling GPUs for NCA-AIIO exam prep.
This is the second article in the series, after Build an NVIDIA k8s Lab on an Old Gaming Laptop .
Like Part 1, this article helps you prepare for the NVIDIA-Certified Associate: AI Infrastructure and Operations (NCA-AIIO) exam. The exam does not require hands-on work - it is multiple-choice. These eleven labs are extra: they help you understand the NVIDIA GPU stack in practice. That is especially useful if you already work with Kubernetes and want the NVIDIA-specific pieces (DCGM, GPU Operator, Triton, scheduling) to click, not just read about them on slides.
Table of Contents
Where Part 1 Left Off#
In Part 1 we turned an old HP gaming laptop (RTX 2080, 8 GB; Windows 11 Home) into a working Kubernetes GPU lab on Ubuntu 26.04 in WSL2 → Docker → Kind → the NVIDIA GPU Operator, with a small LLM served on the GPU as the finale.
This follow-up walks through GPU operations hands-on - monitoring, sharing, serving, and scheduling.
- Lab 1 - Live GPU Telemetry with DCGM
- Lab 2 - nvidia-smi tool
- Lab 3 - Operator Validation Chain - Break and Fix
- Lab 4 - Container Runtime Comparison - runc vs. nvidia
- Lab 5 - Sharing One GPU with Time-Slicing
- Lab 6 - The NGC Container Ecosystem
- Lab 7 - NVIDIA Dynamo-Triton (Inference Server)
- Lab 8 - TensorRT Optimization - FP32 vs. FP16 Benchmarking
- Lab 9 - GPU Resource Contention and Job Scheduling
- Lab 10 - Pod Priority and Preemption
- Lab 11 - CUDA Profiling with Nsight Systems
Lab 1: Live GPU Telemetry with DCGM#
NVIDIA DCGM (Data Center GPU Manager) is the standard way to monitor GPUs in
production, and dcgm-exporter exposes its metrics in Prometheus format on port
9400. The GPU Operator can deploy it for you - it’s one of the components we
deliberately switched off in Part 1 to save memory. Now we want it.
Turning it on (and the WSL gotcha)#
Update the same gpu-operator-values.yaml from Part 1. Only dcgmExporter
changes - set it to true. Keep dcgm at false (no standalone host engine in
WSL). Full file:
driver:        { enabled: false }   # Driver lives in Windows / WSL - do NOT install
toolkit:       { enabled: false }   # Containerd configured manually above
devicePlugin:  { enabled: true  }
dcgm:          { enabled: false }   # No bare-metal DCGM in WSL
dcgmExporter:  { enabled: true  }
nfd:           { enabled: true  }
gfd:           { enabled: false }   # GFD reads /sys/bus/pci - absent in WSL
migManager:    { enabled: false }   # No MIG support on consumer GPUs
Do not set dcgm.enabled=true on this WSL node. Some guides enable both the
standalone DCGM host engine and the exporter. That fails here - the exporter goes
into CrashLoopBackOff and looks for a host engine that never comes up:
level=INFO msg="Attempting to connect to remote hostengine at nvidia-dcgm:5555"
level=ERROR msg="Failed to connect to remote hostengine" address=nvidia-dcgm:5555
 error="error connecting to nv-hostengine: Host engine connection invalid/disconnected"
With dcgm.enabled=false and dcgmExporter.enabled=true, the exporter uses its
embedded DCGM engine instead of a separate nvidia-dcgm pod. Apply the
values file:
helm upgrade gpu-operator nvidia/gpu-operator -n gpu-operator \
  -f gpu-operator-values.yaml --version v26.3.3
This time the exporter started cleanly:
msg="Registry built successfully" collector_count=2
msg="HTTP server started - ready to serve metrics"
msg="Listening on" address=[::]:9400
A couple of benign warnings show up and are expected on this hardware - “no switches to monitor” (no NVSwitch/NVLink on a laptop) and “CPU hierarchy … module not currently loaded.” Neither stops the GPU metrics from flowing.
Reading the metrics#
dcgm-exporter publishes a Prometheus endpoint; scrape it from inside the
cluster:
kubectl run dcgm-curl -n gpu-operator --image=curlimages/curl:8.17.0 --restart=Never \
  --command -- sh -c 'curl -s http://nvidia-dcgm-exporter:9400/metrics'
kubectl logs dcgm-curl -n gpu-operator | grep '^DCGM_FI_DEV_'
On this RTX 2080, 15 distinct DCGM_FI_DEV_* series are exposed. At idle:
| Metric | Value (idle) | Meaning |
|---|---|---|
DCGM_FI_DEV_GPU_UTIL |
0 | GPU utilization % |
DCGM_FI_DEV_MEM_COPY_UTIL |
6 | memory-controller utilization % |
DCGM_FI_DEV_FB_USED |
82 | frame buffer used (MiB) |
DCGM_FI_DEV_FB_FREE |
7906 | frame buffer free (MiB) |
DCGM_FI_DEV_POWER_USAGE |
11.6 | board power (W) |
DCGM_FI_DEV_GPU_TEMP |
42 | GPU temperature (°C) |
DCGM_FI_DEV_SM_CLOCK |
300 | SM clock (MHz) |
(Plus MEM_CLOCK, ENC_UTIL, DEC_UTIL, FB_RESERVED, TOTAL_ENERGY_CONSUMPTION,
PCIE_REPLAY_COUNTER, MEMORY_TEMP, and VGPU_LICENSE_STATUS.)
Watching the numbers move under load#
Idle metrics are dull. The point of monitoring is to see a workload’s signature.
From your WSL terminal (where kubectl talks to the Kind cluster), redeploy the
Part 1 Ollama workload, load Llama 3.2 3B, and drive a sustained generation loop
while sampling DCGM:
# Redeploy Ollama (uses ollama.yaml from Part 1)
kubectl apply -f ollama.yaml
kubectl rollout status deploy/ollama --timeout=300s

POD=$(kubectl get pods -l app=ollama -o jsonpath='{.items[0].metadata.name}')
kubectl exec "$POD" -- ollama pull llama3.2:3b

# Terminal 1: start sustained generation (Ollama image has no curl - use ollama run)
kubectl exec "$POD" -- ollama run llama3.2:3b \
  "Write a 5000 word essay about DCGM and GPU monitoring in Kubernetes." &

# Terminal 2 (or same shell after the line above): sample DCGM every second
kubectl port-forward -n gpu-operator svc/nvidia-dcgm-exporter 9400:9400 &
PF=$!
sleep 2
for i in $(seq 1 60); do
  M=$(curl -s http://localhost:9400/metrics)
  U=$(echo "$M" | awk '/^DCGM_FI_DEV_GPU_UTIL\{/{print $NF}')
  P=$(echo "$M" | awk '/^DCGM_FI_DEV_POWER_USAGE\{/{print $NF}')
  F=$(echo "$M" | awk '/^DCGM_FI_DEV_FB_USED\{/{print $NF}')
  C=$(echo "$M" | awk '/^DCGM_FI_DEV_SM_CLOCK\{/{print $NF}')
  printf "%s  util=%s%%  power=%sW  fb=%s MiB  sm_clock=%s MHz\n" \
    "$(date +%H:%M:%S)" "$U" "$P" "$F" "$C"
  sleep 1
done
kill $PF
wait
A one-shot dcgm-curl pod often misses LLM bursts - the model finishes before the
scrape lands. Port-forward plus a 1-second loop catches the signature.
| Metric | Idle | Under load | What it tells you |
|---|---|---|---|
DCGM_FI_DEV_GPU_UTIL |
0 % | 65 % | the SMs are busy doing inference |
DCGM_FI_DEV_MEM_COPY_UTIL |
6 % | 57 % | heavy memory traffic feeding the cores |
DCGM_FI_DEV_FB_USED |
83 MiB | 3346 MiB | the 3B model resident in VRAM |
DCGM_FI_DEV_POWER_USAGE |
11.2 W | 150.6 W | the card pinned at its TDP |
DCGM_FI_DEV_GPU_TEMP |
41 °C | 77 °C | thermals climbing under sustained work |
DCGM_FI_DEV_SM_CLOCK |
300 MHz | 1800 MHz | GPU boosted to full clocks |
Values in the Under load column are from a live 90-second Ollama generation
run on this lab: GPU_UTIL held 56-67 %, power stayed at
the ~150 W cap, and FB_USED jumped from 83 MiB to 3346 MiB within the first sample.
That table is the AI-Operations lesson. Power jumping from 11 W to a 150 W cap, clocks boosting 6×, and frame-buffer usage revealing exactly how much VRAM a model consumes - these are the signals you reason about when you size hardware, chase the “low GPU utilization” problems the Run:ai reading describes, or set alerts in production. In a real cluster you’d point Prometheus at this endpoint and graph it in Grafana; the metric names are identical on a DGX as on this laptop.
Key points#
- DCGM is the production standard for GPU monitoring;
dcgm-exporterexposes metrics in Prometheus format on port 9400, ready for Grafana dashboards. - In WSL, use the embedded engine: set
dcgmExporter.enabled=truebut keepdcgm.enabled=false. Enabling the standalone host engine causesCrashLoopBackOffbecause there is nonvidia-dcgmpod to connect to. - Metrics reveal a workload’s signature: under load
GPU_UTIL,POWER_USAGE,SM_CLOCK, andFB_USEDall jump - exactly the signals you use to size hardware, diagnose low utilization, and set production alerts. - The metric names are identical across hardware - the same
DCGM_FI_DEV_*series appear on a DGX as on this laptop, so what you learn here transfers directly to production.
Lab 2: nvidia-smi tool#
The standard view#
Tue Jul  7 23:30:56 2026
+-----------------------------------------------------------------------------------------+
| NVIDIA-SMI 580.108                Driver Version: 581.83         CUDA Version: 13.0     |
+-----------------------------------------+------------------------+----------------------+
| GPU  Name                 Persistence-M | Bus-Id          Disp.A | Volatile Uncorr. ECC |
| Fan  Temp   Perf          Pwr:Usage/Cap |           Memory-Usage | GPU-Util  Compute M. |
|                                         |                        |               MIG M. |
|=========================================+========================+======================|
|   0  NVIDIA GeForce RTX 2080        On  |   00000000:01:00.0  On |                  N/A |
| N/A   46C    P8             11W /  150W |     757MiB /   8192MiB |      0%      Default |
|                                         |                        |                  N/A |
+-----------------------------------------+------------------------+----------------------+

+-----------------------------------------------------------------------------------------+
| Processes:                                                                              |
|  GPU   GI   CI              PID   Type   Process name                        GPU Memory |
|        ID   ID                                                               Usage      |
|=========================================================================================|
|    0   N/A  N/A              30      G   /Xwayland                             N/A      |
+-----------------------------------------------------------------------------------------+
Key observations:
- ECC: N/A - consumer GPUs don’t have ECC memory. Data-center cards (A100,
H100) show
Enabled/Disabled. - MIG Mode: N/A - MIG requires Ampere or later architecture. Our Turing GPU can’t partition.
- Persistence Mode: Enabled - WSL keeps it on by default; on bare metal you’d enable it explicitly for production.
- Compute Mode: Default - allows any process to use the GPU. On shared
servers you’d set
Exclusive_Process. - 757 MiB used at idle - Windows/Xwayland holds VRAM even when the cluster
is idle (
/Xwaylandin Processes). Sign out of Windows or run headless over SSH to free more for workloads (see Part 1).
Full query mode (nvidia-smi -q)#
Selected fields from the 80+ lines of output:
| Field | Value | Notes |
|---|---|---|
| Product Architecture | Turing | Know the generations: Turing → Ampere → Hopper → Blackwell |
| Driver Model | WDDM | Windows-specific (Windows Display Driver Model); bare metal Linux shows “N/A” |
| PCIe Generation Max | 3 | data-center GPUs use PCIe 4 or 5 |
| Link Width | 16x | full-width slot |
| Power Limit | 150 W | power.limit is configurable on DC GPUs via nvidia-smi -pl |
| Max SM Clock | 2100 MHz | the ceiling the GPU boosts to under load |
| Max Memory Clock | 7001 MHz | GDDR6 physical clock frequency |
Topology (nvidia-smi topo -m)#
        GPU0    CPU Affinity    NUMA Affinity   GPU NUMA ID
GPU0     X                              N/A

Legend:

  X    = Self
  SYS  = Connection traversing PCIe as well as the SMP interconnect between NUMA nodes (e.g., QPI/UPI)
  NODE = Connection traversing PCIe as well as the interconnect between PCIe Host Bridges within a NUMA node
  PHB  = Connection traversing PCIe as well as a PCIe Host Bridge (typically the CPU)
  PXB  = Connection traversing multiple PCIe bridges (without traversing the PCIe Host Bridge)
  PIX  = Connection traversing at most a single PCIe bridge
  NV#  = Connection traversing a bonded set of # NVLinks
A single-GPU laptop shows only X (self) and GPU NUMA ID = N/A. On a multi-GPU
server you’d see the interconnect type between GPUs: NV# (NVLink), PIX/PXB/PHB/SYS
(various PCIe distances). Know the legend - it explains what interconnect topology
means for distributed training performance.
Live monitoring (nvidia-smi dmon)#
# gpu pwr gtemp mtemp sm mem enc dec jpg ofa mclk pclk
 0 10 40 - 0 6 0 0 0 0 405 300
dmon prints a fresh line every second - useful for eyeballing utilization during
a job without setting up Prometheus. The columns correspond directly to the DCGM
fields from Lab 1.
What’s missing (vs. a data-center GPU)#
| Feature | Our RTX 2080 | A100/H100 |
|---|---|---|
| ECC Memory | N/A | Enabled (catches DRAM bit-flips) |
| MIG Mode | N/A | Configurable (up to 7 instances) |
| NVLink | Absent | Up to 18 links, 900 GB/s |
| NVSwitch | Absent | Full all-to-all GPU mesh |
| Power limit tuning | Fixed at 150W | Adjustable via nvidia-smi -pl |
| Persistence mode mgmt | Auto (WSL) | Manual (nvidia-smi -pm 1) |
Key points#
nvidia-smiis the first tool to reach for - the standard view gives you driver/CUDA versions, memory usage, power, temperature, and running processes at a glance.- Know what the fields mean: ECC, MIG mode, persistence mode, and compute mode all behave differently on consumer GPUs (N/A / Default) versus data-center cards.
nvidia-smihas more than the default view:-qfor full detail,topo -mfor interconnect topology, anddmonfor live per-second monitoring without setting up Prometheus.
Lab 3: Operator Validation Chain - Break and Fix#
The GPU Operator doesn’t just install components; it continuously validates
the stack. On our WSL lab (driver and toolkit disabled, GPU Operator v26+), that
happens in one pod: nvidia-operator-validator. It runs four init containers in
order - driver-validation → toolkit-validation → cuda-validation →
plugin-validation - then stays Running as a watchdog.
On bare-metal installs with the Operator-managed driver, you may also see a
separate nvidia-cuda-validator pod in Completed state. We do not - with
driver.enabled=false and toolkit.enabled=false there is no cuda-validator
DaemonSet:
kubectl get ds -n gpu-operator | grep validator
# nvidia-operator-validator   1   1   1   ...
Healthy state (before breaking anything)#
nvidia-operator-validator-znlxg 1/1 Running
Confirm CUDA validation passed inside the init chain:
kubectl logs -n gpu-operator -l app=nvidia-operator-validator -c cuda-validation
# cuda workload validation is successful
Break: remove the WSL library path#
We removed the ldconfig entry that lets the runtime find libnvidia-ml.so.1:
docker exec kind-control-plane bash -c \
  'rm -f /etc/ld.so.conf.d/wsl.conf && ldconfig'

# Verify inside the Kind node (not on the WSL host)
docker exec kind-control-plane bash -c \
  'ldconfig -p | grep libnvidia-ml || echo NOT FOUND'
Inside kind-control-plane → NOT FOUND. On the WSL host the library may
still be visible - that is expected. The break targets the node container where
pods actually run.
Trigger revalidation#
Delete the validator pod so the Operator recreates it against the now-broken state:
kubectl delete pod -n gpu-operator -l app=nvidia-operator-validator
Observe the failure#
After ~30 seconds the Operator recreated the validator:
nvidia-operator-validator-cb2zf 0/1 Init:RunContainerError
The cuda-validation init container tried to run a CUDA workload but the
container runtime couldn’t initialize NVML (same ERROR_LIBRARY_NOT_FOUND from
Part 1). The pod is stuck in Init - it can’t complete validation, which tells
the Operator the node is not healthy for GPU workloads.
In production, this is the signal that triggers an alert: the operator-validator
status goes to Error/CrashLoop, and the node should be cordoned until the
issue is resolved.
Fix: restore the library path#
docker exec kind-control-plane bash -c \
  'echo /usr/lib/wsl/lib > /etc/ld.so.conf.d/wsl.conf && ldconfig'

# Verify inside the Kind node
docker exec kind-control-plane bash -c 'ldconfig -p | grep libnvidia-ml'
Delete the broken validator one more time - the Operator recreates it:
kubectl delete pod -n gpu-operator -l app=nvidia-operator-validator
kubectl get pods -n gpu-operator -l app=nvidia-operator-validator -w
Healthy end state on this lab:
nvidia-operator-validator-g47xz 1/1 Running ← stack healthy
CUDA check again:
kubectl logs -n gpu-operator -l app=nvidia-operator-validator -c cuda-validation
# cuda workload validation is successful
What the validators actually check#
| Check | Where (our lab) | What a failure means |
|---|---|---|
| Driver / toolkit / CUDA / plugin | nvidia-operator-validator init containers |
Runtime can’t reach the GPU (driver, libs, device mount, or containerd config broken) |
| CUDA vector-add | cuda-validation init container |
NVML or CUDA libraries missing inside the Kind node |
| Continuous watchdog | nvidia-operator-validator main container |
One or more Operator-managed components failed to deploy or configure correctly |
Key points#
- The GPU Operator continuously validates the stack, not just installs it -
the
nvidia-operator-validatorruns an ordered init chain (driver → toolkit → CUDA → plugin) and then stays up as a watchdog.
Lab 4: Container Runtime Comparison - runc vs. nvidia#
A container gets access to a GPU through the container runtime. This lab makes that layer concrete.
The host has two GPU-relevant runtimes#
docker info --format '{{.Runtimes}}' dumps the entire runtime map (pages of JSON).
Use grep instead:
$ docker info | grep -E 'Runtimes:|Default Runtime:'
 Runtimes: runc io.containerd.runc.v2 nvidia
 Default Runtime: runc
Docker registers three names; the lab cares about two:
| Runtime | Role |
|---|---|
runc |
Default OCI runtime - no GPU injection |
nvidia |
nvidia-container-runtime - prestart hook injects GPU devices and driver libs |
io.containerd.runc.v2 |
containerd’s internal shim (ignore for this lab) |
nvidia-container-runtime (at /usr/bin/nvidia-container-runtime) is a thin
wrapper around runc: it runs a prestart hook that injects the GPU devices
and driver libraries into the container, then hands off to runc to actually
run it.
Same image, two runtimes#
Use the same CUDA test image from Part 1:
# runc (default), no GPU injection - nvidia-smi not on PATH without the hook
$ docker run --rm --runtime=runc nvidia/cuda:13.3.0-base-ubi9 nvidia-smi -L
exec: "nvidia-smi": executable file not found in $PATH

# --gpus all uses the nvidia runtime hook - GPU and driver libs injected
$ docker run --rm --gpus all nvidia/cuda:13.3.0-base-ubi9 nvidia-smi -L
GPU 0: NVIDIA GeForce RTX 2080 (UUID: GPU-42ade211-f5f8-9753-5679-627fd6d9f54a)
The identical image sees a GPU only when the nvidia runtime injects it. That injection is exactly what the GPU Operator configures cluster-wide.
Inside the Kind node#
The node’s containerd was configured (in Part 1) to use nvidia as its default runtime, so every pod can get a GPU:
default_runtime_name = 'nvidia'
BinaryName = '/usr/bin/nvidia-container-runtime'
Key points#
nvidia-container-runtimeis a thin wrapper aroundrunc- a prestart hook injects the GPU devices and driver libraries, then hands off torunc.
Lab 5: Sharing One GPU with Time-Slicing#
The lab has exactly one GPU, so by default only one pod that requests
nvidia.com/gpu: 1 can be scheduled at a time - a second one stays Pending.
Time-slicing lets the device plugin advertise a single physical GPU as
several schedulable units, so multiple pods can interleave on it.
A note on MIG: the study guide’s Multi-Instance GPU (MIG) reading describes hardware partitioning, but MIG is only available on data-center GPUs (A100/H100-class). On a Turing RTX 2080 you cannot do MIG - and knowing why (MIG needs Ampere-or-later hardware support) is worth remembering. Time-slicing is the software-level sharing mechanism that works on any GPU, including this one.
Before#
$ kubectl get node kind-control-plane -o jsonpath='{.status.capacity.nvidia\.com/gpu}'
1
One schedulable GPU.
Configure time-slicing#
Create a ConfigMap describing four replicas of the GPU resource, then point the GPU Operator’s device plugin at it through the ClusterPolicy:
# time-slicing-config.yaml
apiVersion: v1
kind: ConfigMap
metadata:
  name: time-slicing-config
  namespace: gpu-operator
data:
  any: |-
    version: v1
    flags:
      migStrategy: none
    sharing:
      timeSlicing:
        resources:
        - name: nvidia.com/gpu
          replicas: 4
kubectl apply -f time-slicing-config.yaml

kubectl patch clusterpolicy cluster-policy --type merge \
  -p '{"spec":{"devicePlugin":{"config":{"name":"time-slicing-config","default":"any"}}}}'
The operator restarts the device plugin daemonset automatically. About a minute later:
After#
$ kubectl get node kind-control-plane -o jsonpath='{.status.capacity.nvidia\.com/gpu}'
4
One physical RTX 2080, now advertised as four schedulable nvidia.com/gpu
units.
Proving pods actually share the card#
Deploy three pods, each requesting nvidia.com/gpu: 1. After time-slicing, that
limit means one schedulable slice - not exclusive use of the full physical
GPU. All three pods still share the same RTX 2080:
# gpu-share-demo.yaml
apiVersion: apps/v1
kind: Deployment
metadata:
  name: gpu-share-demo
  labels:
    app: gpu-share-demo
spec:
  replicas: 3
  selector:
    matchLabels:
      app: gpu-share-demo
  template:
    metadata:
      labels:
        app: gpu-share-demo
    spec:
      containers:
      - name: cuda
        image: nvidia/cuda:13.3.0-base-ubi9
        command: ["sleep", "infinity"]
        resources:
          limits:
            nvidia.com/gpu: 1   # one time-slice (1 of 4 advertised units), not the whole card
kubectl apply -f gpu-share-demo.yaml
kubectl get pods -l app=gpu-share-demo -o wide
All three schedule and run on the single node - which would have been impossible before time-slicing:
gpu-share-demo-…-8m82k Running kind-control-plane
gpu-share-demo-…-p758h Running kind-control-plane
gpu-share-demo-…-pbbvd Running kind-control-plane
And each container, running nvidia-smi -L, reports the same physical GPU -
identical UUID - confirming they’re sharing one card rather than seeing phantom
hardware:
for p in $(kubectl get pods -l app=gpu-share-demo -o name); do
  echo -n "$p: "
  kubectl exec "$p" -- nvidia-smi -L
done
pod/gpu-share-demo-…-8m82k: GPU 0: NVIDIA GeForce RTX 2080 (UUID: GPU-42ade211-f5f8-9753-5679-627fd6d9f54a)
pod/gpu-share-demo-…-p758h: GPU 0: NVIDIA GeForce RTX 2080 (UUID: GPU-42ade211-f5f8-9753-5679-627fd6d9f54a)
pod/gpu-share-demo-…-pbbvd: GPU 0: NVIDIA GeForce RTX 2080 (UUID: GPU-42ade211-f5f8-9753-5679-627fd6d9f54a)
A caution worth documenting#
Time-slicing provides no memory isolation. All four slices draw from the same 8 GB frame buffer, so four pods each loading a 3 GB model will hit Out-of-Memory. The replica count controls scheduling concurrency, not VRAM. On 8 GB, keep the combined working set under the frame-buffer size - a key reason the study guide pairs this with the “low GPU utilization” reading: sharing improves utilization only when individual jobs are small enough to coexist.
nvidia-smi makes this visible. From any gpu-share-demo pod, memory is the
whole card - not 8 GB ÷ 4 slices:
for p in $(kubectl get pods -l app=gpu-share-demo -o name); do
  echo "=== $p ==="
  kubectl exec "$p" -- nvidia-smi \
    --query-gpu=index,name,memory.total,memory.used,memory.free \
    --format=csv
done
Example (three idle pods, Ollama still holding VRAM from an earlier run):
=== pod/gpu-share-demo-…-8m82k ===
index, name, memory.total [MiB], memory.used [MiB], memory.free [MiB]
0, NVIDIA GeForce RTX 2080, 8192 MiB, 3348 MiB, 4640 MiB

=== pod/gpu-share-demo-…-p758h ===
index, name, memory.total [MiB], memory.used [MiB], memory.free [MiB]
0, NVIDIA GeForce RTX 2080, 8192 MiB, 3348 MiB, 4640 MiB

=== pod/gpu-share-demo-…-pbbvd ===
index, name, memory.total [MiB], memory.used [MiB], memory.free [MiB]
0, NVIDIA GeForce RTX 2080, 8192 MiB, 3348 MiB, 4640 MiB
Every pod reports 8192 MiB total and the same used/free - they share one
frame buffer. nvidia.com/gpu: 1 does not reserve 2 GB of VRAM per pod; it only
wins a scheduling slot. Plan capacity from memory.used on the physical GPU, not
from the slice count.
Key points#
- Time-slicing is software-level GPU sharing that works on any GPU, including consumer cards - unlike MIG, which needs Ampere-or-later data-center hardware.
- Replicas control scheduling concurrency, not hardware partitioning: a
single physical GPU is advertised as N schedulable
nvidia.com/gpuunits, so multiple pods can interleave on it. - All slices share one physical card: every pod reports the same GPU UUID and the same total/used/free VRAM - the frame buffer is shared, not divided.
- There is no memory isolation: all slices draw from the same 8 GB, so
oversubscribing VRAM causes OOM. Sharing improves utilization only when
individual jobs are small enough to coexist - size capacity from
memory.used, not the slice count.
Lab 6: The NGC Container Ecosystem#
NGC (NVIDIA GPU Cloud, nvcr.io) is NVIDIA’s registry of GPU-optimized
containers, models, and Helm charts - the catalog behind the NVIDIA software
stack. This lab has been pulling from it all along.
What’s already here#
The Kind node has accumulated several nvcr.io images just from the labs so
far:
nvcr.io/nvidia/tritonserver
nvcr.io/nvidia/tensorrt
nvcr.io/nvidia/cloud-native/dcgm
nvcr.io/nvidia/gpu-operator
nvcr.io/nvidia/k8s-device-plugin
nvcr.io/nvidia/k8s/dcgm-exporter

... (and more)
Every component of the GPU Operator, Triton, and TensorRT came from NGC. That’s the point: NGC packages “the entire user-space software stack - CUDA libraries, cuDNN, TensorRT, and the framework” into ready-to-run containers (paraphrased from NVIDIA’s NGC documentation).
A curated NGC container#
The official CUDA sample container is a minimal, signed NGC image:
# ngc-vectoradd.yaml
apiVersion: v1
kind: Pod
metadata:
  name: ngc-vectoradd
spec:
  restartPolicy: Never
  containers:
  - name: ngc-vectoradd
    image: nvcr.io/nvidia/k8s/cuda-sample:vectoradd-cuda12.5.0
    resources:
      limits:
        nvidia.com/gpu: 1
kubectl apply -f ngc-vectoradd.yaml
kubectl logs ngc-vectoradd
[Vector addition of 50000 elements]
Copy input data from the host memory to the CUDA device
CUDA kernel launch with 196 blocks of 256 threads
Copy output data from the CUDA device to the host memory
Test PASSED
Done
NGC isn’t just deep learning: RAPIDS#
To show the breadth of the ecosystem, we ran RAPIDS - NVIDIA’s GPU-accelerated data-science suite - which does for pandas/scikit-learn what CUDA did for deep learning:
# rapids-demo.yaml
apiVersion: v1
kind: Pod
metadata:
  name: rapids-demo
spec:
  restartPolicy: Never
  containers:
  - name: rapids-demo
    image: nvcr.io/nvidia/rapidsai/base:26.06-cuda12-py3.14
    command: ["python3", "-c"]
    args:
    - |
      import time, cudf
      n = 10_000_000
      df = cudf.DataFrame({"x": range(n), "y": range(n)})
      t0 = time.time()
      df["z"] = df["x"] * 2 + df["y"]
      df.groupby(df["x"] % 100).agg({"z": "sum"})
      print(f"cuDF: processed {n:,} rows on GPU in {time.time()-t0:.3f}s")
      print(f"cuDF version: {cudf.__version__}")
    resources:
      limits:
        nvidia.com/gpu: 1
kubectl apply -f rapids-demo.yaml
kubectl get pod rapids-demo -w   # first pull took ~7 min on this lab
Right after apply, the pod often sits in ContainerCreating for a long time.
That is expected - unlike the tiny vectoradd image above, the RAPIDS base image
is ~7 GB compressed. The Kind node is
pulling it from nvcr.io before the container can start:
$ kubectl describe pod rapids-demo
...
Events:
  Type    Reason     Age    From               Message
  ----    ------     ----   ----               -------
  Normal  Scheduled  6m54s  default-scheduler  Successfully assigned default/rapids-demo to kind-control-plane
  Normal  Pulling    6m53s  kubelet            spec.containers{rapids-demo}: Pulling image "nvcr.io/nvidia/rapidsai/base:26.06-cuda12-py3.14"
  Normal  Pulled     22s    kubelet            spec.containers{rapids-demo}: Successfully pulled image "nvcr.io/nvidia/rapidsai/base:26.06-cuda12-py3.14" in 6m31.076s (6m31.076s including waiting). Image size: 6702484737 bytes.
  Normal  Created    22s    kubelet            spec.containers{rapids-demo}: Container created
  Normal  Started    22s    kubelet            spec.containers{rapids-demo}: Container started
Scheduled means the scheduler found a node and a GPU slot. Pulling → Pulled is the long step - here 7m33s to download ~7 GB. Created and Started follow within a second once the image is local. Then fetch logs:
kubectl logs rapids-demo
Result - a 10-million-row dataframe operation (multiply, add, group-by, aggregate) executed entirely on the RTX 2080:
cuDF: processed 10,000,000 rows on GPU in 0.089s
cuDF version: 26.06.01
Key points#
- NGC’s role: the single source of NVIDIA-optimized, versioned, signed containers - frameworks (PyTorch, TensorFlow), inference (Triton), data science (RAPIDS), HPC, and pre-trained models. It also hosts Helm charts (the GPU Operator itself) and SDKs.
- The breadth of AI use cases: GPUs accelerate more than LLMs - RAPIDS for analytics, cuOpt for optimization, Clara for healthcare, etc. Running cuDF proves GPUs accelerate the whole data pipeline, not just model inference.
- Versioning and reproducibility: NGC tags pin CUDA version, Python version, and framework release together - critical for reproducible deployments across environments.
Lab 7: NVIDIA Dynamo-Triton (Inference Server)#
NVIDIA now markets this product as NVIDIA Dynamo-Triton
-
formerly NVIDIA Triton Inference Server. It deploys models across TensorRT,
PyTorch, ONNX, OpenVINO, Python, RAPIDS FIL, and more. NGC images, the
tritonserver binary, and the GitHub quickstart still use the Triton name;
this lab keeps those commands as-is. (For LLM-specific serving, NVIDIA also
offers NVIDIA Dynamo - a separate stack with disaggregated serving and
KV-cache features.)
This lab follows NVIDIA’s official Triton quickstart step for step. The quickstart runs Triton in Docker on the host; here the same flow runs inside Kubernetes on the Kind GPU pod from Part 1.
| Quickstart step | This lab |
|---|---|
| Create a model repository | curl the densenet_onnx files (same model the quickstart uses) |
Launch Triton
- docker run ... tritonserver |
kubectl apply -f triton-server.yaml (GPU via GPU Operator) |
Verify Triton is running
- curl localhost:8000/v2/health/ready |
Same, via kubectl port-forward |
Send an inference request
- image_client from tritonserver:*-py3-sdk |
Same image_client command and mug.jpg example |
Triton is a core piece of the NVIDIA inference stack. Running it on the lab proves the full serving pipeline: model repository → Triton → GPU Operator device plugin → GPU → response.
Part 1 served an LLM through Ollama. Triton is different: you bring a model
repository (ONNX files + config.pbtxt per model). That setup is not in Part 1
or Labs 1-6. No Python or training required - download NVIDIA’s standard
densenet_onnx example from the ONNX Model Zoo.
Step 1: Download the model repository (one-time)#
Quickstart: Create A Model Repository
Triton expects a directory per model:
/models/densenet_onnx/
  config.pbtxt
  densenet_labels.txt
  1/model.onnx
The quickstart
uses a helper script (fetch_models.sh) that also builds inception_onnx via
Python - skip that on WSL. Download the densenet_onnx files directly with
curl (no script, no Python):
TRITON_EXAMPLES="https://raw.githubusercontent.com/triton-inference-server/server/main/docs/examples/model_repository"

mkdir -p model_repository/densenet_onnx/1
curl -fsSL -o model_repository/densenet_onnx/1/model.onnx \
  https://github.com/onnx/models/raw/main/validated/vision/classification/densenet-121/model/densenet-7.onnx
curl -fsSL -o model_repository/densenet_onnx/config.pbtxt \
  "$TRITON_EXAMPLES/densenet_onnx/config.pbtxt"
curl -fsSL -o model_repository/densenet_onnx/densenet_labels.txt \
  "$TRITON_EXAMPLES/densenet_onnx/densenet_labels.txt"
This downloads densenet_onnx (image classifier, 3×224×224 input) from the
ONNX Model Zoo plus its config.pbtxt from the Triton repo.
Copy the model into the Kind node. Triton mounts hostPath: /models on the
control-plane container:
docker exec kind-control-plane mkdir -p /models
docker cp model_repository/densenet_onnx kind-control-plane:/models/
docker exec kind-control-plane ls -R /models
You should see /models/densenet_onnx/config.pbtxt and
/models/densenet_onnx/1/model.onnx.
Step 2: Deploy Triton#
Quickstart: Launch Triton and Verify Triton Is Running Correctly
# triton-server.yaml
apiVersion: v1
kind: Pod
metadata:
  name: triton-server
  labels: { app: triton }
spec:
  restartPolicy: Never
  containers:
  - name: triton
    image: nvcr.io/nvidia/tritonserver:26.06-py3
    args: ["tritonserver", "--model-repository=/models"]
    ports:
    - containerPort: 8000   # HTTP inference
    - containerPort: 8001   # gRPC inference
    - containerPort: 8002   # Prometheus metrics
    resources:
      limits:
        nvidia.com/gpu: 1
    volumeMounts:
    - name: models
      mountPath: /models
  volumes:
  - name: models
    hostPath: { path: /models, type: Directory }
kubectl apply -f triton-server.yaml
kubectl get pod triton-server -w   # first pull took ~7 min on this lab
kubectl wait --for=condition=Ready pod/triton-server --timeout=600s
kubectl port-forward pod/triton-server 8000:8000 8001:8001 8002:8002 &
curl -s localhost:8000/v2/health/ready
On this laptop the first nvcr.io/nvidia/tritonserver:26.06-py3 pull took about
7 minutes (ContainerCreating while the Kind node downloads ~7.5 GB). Once
the image was local, Triton reached Ready and curl .../v2/health/ready
returned HTTP 200 within seconds.
Inference proof#
Quickstart: Send an Inference Request
Use NVIDIA’s image_client from the Triton SDK container - no Python on your
host. The mug.jpg path is inside the SDK image at /workspace/images/
(not on your WSL host). The command matches the quickstart; the only difference
is that Triton runs in the Kind pod (reached via port-forward) instead of a
local docker run:
docker run --rm --net=host nvcr.io/nvidia/tritonserver:26.06-py3-sdk \
  /workspace/install/bin/image_client -m densenet_onnx -c 3 -s INCEPTION \
  /workspace/images/mug.jpg
Full output from this lab (first run also pulls the SDK image):
Status: Downloaded newer image for nvcr.io/nvidia/tritonserver:26.06-py3-sdk

=================================
== Triton Inference Server SDK ==
=================================

NVIDIA Release 26.06 (build 347409142)

Copyright (c) 2018-2025, NVIDIA CORPORATION & AFFILIATES.  All rights reserved.

Various files include modifications (c) NVIDIA CORPORATION & AFFILIATES.  All rights reserved.

GOVERNING TERMS: The software and materials are governed by the NVIDIA Software License Agreement
(found at https://www.nvidia.com/en-us/agreements/enterprise-software/nvidia-software-license-agreement/)
and the Product-Specific Terms for NVIDIA AI Products
(found at https://www.nvidia.com/en-us/agreements/enterprise-software/product-specific-terms-for-ai-products/).

WARNING: The NVIDIA Driver was not detected.  GPU functionality will not be available.
   Use the NVIDIA Container Toolkit to start this container with GPU support; see
   https://docs.nvidia.com/datacenter/cloud-native/ .

Handling connection for 8000
Handling connection for 8000
Handling connection for 8000
Request 0, batch size 1
Image '/workspace/images/mug.jpg':
    15.349563 (504) = COFFEE MUG
    13.227462 (968) = CUP
    10.424891 (505) = COFFEEPOT
The driver warning is expected - the SDK container is only a thin client;
it talks to Triton over HTTP/gRPC. The GPU does the inference inside the
triton-server pod. Handling connection for 8000 lines come from your
kubectl port-forward in another terminal.
Reading the result: the model outputs a list of 1,000 probabilities (one
per ImageNet class). image_client sorted them and printed the top three
(-c 3):
- 1st place: COFFEE MUG (score 15.35, class 504) - the definitive winner.
- 2nd place: CUP (score 13.23, class 968) - a very logical runner-up, since a mug is a type of cup.
- 3rd place: COFFEEPOT (score 10.42, class 505) - an associated object, but much lower confidence.
Triton Prometheus metrics#
Triton also exposes application-layer metrics on port 8002 (already in
triton-server.yaml). With port-forward running, scrape them after inference:
curl -s localhost:8002/metrics | grep -E '^nv_inference_|^nv_gpu_'
After one image_client run on this lab:
Handling connection for 8002
nv_inference_request_success{model="densenet_onnx",version="1"} 1
nv_inference_request_failure{model="densenet_onnx",reason="OTHER",version="1"} 0
nv_inference_request_failure{model="densenet_onnx",reason="BACKEND",version="1"} 0
nv_inference_request_failure{model="densenet_onnx",reason="CANCELED",version="1"} 0
nv_inference_request_failure{model="densenet_onnx",reason="REJECTED",version="1"} 0
nv_inference_count{model="densenet_onnx",version="1"} 1
nv_inference_exec_count{model="densenet_onnx",version="1"} 1
nv_inference_request_duration_us{model="densenet_onnx",version="1"} 680304
nv_inference_queue_duration_us{model="densenet_onnx",version="1"} 497
nv_inference_compute_input_duration_us{model="densenet_onnx",version="1"} 332
nv_inference_compute_infer_duration_us{model="densenet_onnx",version="1"} 679330
nv_inference_compute_output_duration_us{model="densenet_onnx",version="1"} 27
nv_inference_pending_request_count{model="densenet_onnx",version="1"} 0
nv_gpu_utilization{gpu_uuid="GPU-42ade211-f5f8-9753-5679-627fd6d9f54a"} 0
nv_gpu_memory_total_bytes{gpu_uuid="GPU-42ade211-f5f8-9753-5679-627fd6d9f54a"} 8589934592
nv_gpu_memory_used_bytes{gpu_uuid="GPU-42ade211-f5f8-9753-5679-627fd6d9f54a"} 1035993088
nv_gpu_power_usage{gpu_uuid="GPU-42ade211-f5f8-9753-5679-627fd6d9f54a"} 11.488
nv_gpu_power_limit{gpu_uuid="GPU-42ade211-f5f8-9753-5679-627fd6d9f54a"} 0
Reading it: nv_inference_request_success and nv_inference_count are 1 -
exactly one mug.jpg inference. nv_inference_compute_infer_duration_us ≈ 679 ms
is most of the end-to-end time. nv_gpu_memory_used_bytes ≈ 988 MiB shows
DenseNet resident on the GPU; nv_gpu_utilization reads 0 at scrape time
because the GPU is idle between requests (compare with DCGM under sustained load
in Lab 1). Handling connection for 8002 is from kubectl port-forward.
To generate more load and watch counters climb, use perf_analyzer from the
same SDK image:
docker run --rm --net=host nvcr.io/nvidia/tritonserver:26.06-py3-sdk \
  perf_analyzer -m densenet_onnx -u localhost:8001 -i grpc --concurrency-range 1
Then scrape again - nv_inference_request_success and nv_inference_count
should reflect the analyzer’s run. nv_gpu_utilization and
nv_gpu_memory_used_bytes show how hard the model is hitting the GPU at the
serving layer (complementary to DCGM in Lab 1).
Key points#
- Triton’s role in the NVIDIA AI stack: a production inference server that supports multiple backends (ONNX, TensorRT, PyTorch, TensorFlow), dynamic batching, model versioning, and ensemble pipelines.
- It exposes Prometheus metrics natively (port 8002) - the same pipeline as DCGM but at the application layer: inference count, latency percentiles, queue time.
- Triton sits between a model repository (like NGC) and client applications, abstracting GPU scheduling, batching, and multi-model serving.
Lab 8: TensorRT Optimization - FP32 vs. FP16 Benchmarking#
TensorRT is NVIDIA’s inference optimization toolkit. This lab turns the concept into numbers.
What TensorRT does#
TensorRT takes a trained model (in ONNX, PyTorch, or TensorFlow format) and produces an optimized engine that is tuned to the specific GPU hardware. It applies layer fusion, kernel auto-tuning, precision reduction (FP16/INT8), and memory planning. The result is the same model but executing faster.
The benchmark#
trtexec ships in the TensorRT NGC container, not on a bare WSL host. The
ONNX file from Lab 7 lives on the Kind node at /models/densenet_onnx/1/model.onnx -
not in your home directory - so run trtexec in a GPU pod that mounts the same
hostPath volume as Triton:
# trtexec-fp32.yaml
apiVersion: v1
kind: Pod
metadata:
  name: trtexec-fp32
spec:
  restartPolicy: Never
  containers:
  - name: trtexec
    image: nvcr.io/nvidia/tensorrt:26.05-py3
    args:
    - trtexec
    - --onnx=/models/densenet_onnx/1/model.onnx
    - --saveEngine=/tmp/fp32.plan
    - --verbose
    resources:
      limits:
        nvidia.com/gpu: 1
    volumeMounts:
    - name: models
      mountPath: /models
  volumes:
  - name: models
    hostPath: { path: /models, type: Directory }
trtexec-fp16.yaml is the same pod with three changes - pod name, engine
output path, and the --fp16 flag:
# trtexec-fp16.yaml
apiVersion: v1
kind: Pod
metadata:
  name: trtexec-fp16          # was trtexec-fp32
spec:
  restartPolicy: Never
  containers:
  - name: trtexec
    image: nvcr.io/nvidia/tensorrt:26.05-py3
    args:
    - trtexec
    - --onnx=/models/densenet_onnx/1/model.onnx
    - --saveEngine=/tmp/fp16.plan   # was /tmp/fp32.plan
    - --fp16                        # enable half-precision build
    - --verbose
    resources:
      limits:
        nvidia.com/gpu: 1
    volumeMounts:
    - name: models
      mountPath: /models
  volumes:
  - name: models
    hostPath: { path: /models, type: Directory }
kubectl apply -f trtexec-fp32.yaml
kubectl wait --for=jsonpath='{.status.phase}'=Succeeded pod/trtexec-fp32 --timeout=600s

kubectl apply -f trtexec-fp16.yaml
kubectl wait --for=jsonpath='{.status.phase}'=Succeeded pod/trtexec-fp16 --timeout=600s
Do not run
trtexec --onnx=/models/densenet_onnx/...directly on the WSL shell - that path exists inside the Kind node, andtrtexecis not installed on the host unless you add the TensorRT container or SDK yourself.
Results on the RTX 2080#
Each pod builds the engine, runs a short benchmark, prints a Performance
summary, then exits (Succeeded). Read the headline numbers straight from the
logs:
kubectl logs trtexec-fp32 | grep -E '\[I\] (Throughput:|GPU Compute Time:)'
kubectl logs trtexec-fp16 | grep -E '\[I\] (Throughput:|GPU Compute Time:)'
kubectl logs trtexec-fp32 | grep -i 'Created engine with size'
kubectl logs trtexec-fp16 | grep -i 'Created engine with size'
Use
\[I\]in the grep so you skip[V]verbose explanation lines that also mention Throughput and GPU Compute Time.
TensorRT 10+ prints
Created engine with size: … MiB- notSerialized Engine Size(older logs). If that grep is empty, try:kubectl logs trtexec-fp32 | grep -iE 'engine.*size|Engine built'
On our RTX 2080 with nvcr.io/nvidia/tensorrt:26.05-py3 and DenseNet-121 ONNX:
[07/07/2026-18:56:10] [I] Throughput: 210.777 qps
[07/07/2026-18:56:10] [I] GPU Compute Time: min = 3.27002 ms, max = 8.43604 ms, mean = 4.57421 ms, ...
[07/07/2026-18:56:07] [I] Created engine with size: 31.9207 MiB

[07/07/2026-19:01:53] [I] Throughput: 275.43 qps
[07/07/2026-19:01:53] [I] GPU Compute Time: min = 2.05426 ms, max = 11.6736 ms, mean = 3.49222 ms, ...
[07/07/2026-19:01:50] [I] Created engine with size: 16.0751 MiB
FP32 (trtexec-fp32) |
FP16 (trtexec-fp16) |
|
|---|---|---|
| Throughput | 210.8 qps | 275.4 qps (~1.3×) |
| GPU Compute Time (mean) | 4.57 ms | 3.49 ms (~24% lower) |
| Engine size | 31.9 MiB | 16.1 MiB (~half) |
On Turing, FP16 shows higher qps and lower mean compute time than FP32 - Tensor Cores accelerating half-precision. On larger models (ResNet-50, BERT), FP16 throughput gains are often 2–3×; DenseNet-121 is smaller and more memory-bound, so the ~1.3× gap here is expected.
Why the engine is GPU-specific#
TensorRT engines are not portable between GPU architectures. During the
build, TensorRT benchmarks kernel variants on the exact silicon and bakes
the winners into the .plan / .engine file. An engine built on an RTX 2080
(compute capability 7.5) contains kernels tuned for Turing. Loading that file
on an A100 (8.0) or H100 (9.0) typically fails immediately with a
deserialization or compute-capability mismatch - not a graceful fallback.
Production rule: treat ONNX (or your training export) as the portable artifact; rebuild the TensorRT engine on every target GPU generation. CI/CD pipelines often maintain an engine matrix keyed by GPU SKU.
This is the trade-off: maximum performance on the target hardware, at the cost of needing to rebuild when you change cards. The deployment pipeline is:
Train (any GPU) → Export (ONNX/SavedModel) → TensorRT Build (target GPU)
 → Deploy Engine (Triton / custom app)
Key points#
- TensorRT’s place in the stack: it sits between training frameworks and inference servers (Triton). It’s an offline optimization step, not a runtime.
- Precision trade-offs: FP16 throughput gains are often 2–3× on larger compute-bound models (ResNet-50, BERT); memory-bound workloads (like DenseNet-121, ~1.3× here) see smaller gains. INT8 adds another step up but needs calibration data.
- Why it matters for infrastructure sizing: an FP16-optimized model may need half the GPUs to serve the same traffic, directly affecting hardware planning.
Lab 9: GPU Resource Contention and Job Scheduling#
Cluster orchestration and job scheduling decide who gets a GPU when capacity runs out. The scheduler’s behavior under GPU scarcity is hard to internalize from docs alone. This lab makes it visceral.
Setup: artificial scarcity#
Lab 5 set time-slicing to 4 replicas. For this lab, drop it to 2 so the
node advertises exactly two schedulable nvidia.com/gpu units while you still
have only one physical card.
Either edit time-slicing-config.yaml (replicas: 4 → replicas: 2) or save
and apply this ConfigMap:
# time-slicing-config-2.yaml
apiVersion: v1
kind: ConfigMap
metadata:
  name: time-slicing-config
  namespace: gpu-operator
data:
  any: |-
    version: v1
    flags:
      migStrategy: none
    sharing:
      timeSlicing:
        resources:
        - name: nvidia.com/gpu
          replicas: 2
kubectl apply -f time-slicing-config-2.yaml
If capacity is still 4 after ~60 seconds, restart the device plugin so it
reloads the ConfigMap:
kubectl rollout restart daemonset nvidia-device-plugin-daemonset -n gpu-operator
kubectl rollout status daemonset nvidia-device-plugin-daemonset -n gpu-operator
Confirm capacity:
kubectl get node kind-control-plane -o jsonpath='{.status.capacity.nvidia\.com/gpu}'
Expected:
2
The experiment#
Submit 3 Jobs, each requesting 1 GPU. Each job prints its name, lists the
GPU with nvidia-smi -L, then sleeps 30 seconds so the first two jobs hold
both slots long enough for the third to queue.
# gpu-jobs.yaml
apiVersion: batch/v1
kind: Job
metadata:
  name: gpu-job-1
  labels:
    app: gpu-job
spec:
  ttlSecondsAfterFinished: 300
  template:
    metadata:
      labels:
        app: gpu-job
    spec:
      restartPolicy: Never
      containers:
      - name: cuda
        image: nvidia/cuda:13.3.0-base-ubi9
        command: ["/bin/sh", "-c", "echo gpu-job-1; nvidia-smi -L; sleep 30"]
        resources:
          limits:
            nvidia.com/gpu: 1
---
apiVersion: batch/v1
kind: Job
metadata:
  name: gpu-job-2
  labels:
    app: gpu-job
spec:
  ttlSecondsAfterFinished: 300
  template:
    metadata:
      labels:
        app: gpu-job
    spec:
      restartPolicy: Never
      containers:
      - name: cuda
        image: nvidia/cuda:13.3.0-base-ubi9
        command: ["/bin/sh", "-c", "echo gpu-job-2; nvidia-smi -L; sleep 30"]
        resources:
          limits:
            nvidia.com/gpu: 1
---
apiVersion: batch/v1
kind: Job
metadata:
  name: gpu-job-3
  labels:
    app: gpu-job
spec:
  ttlSecondsAfterFinished: 300
  template:
    metadata:
      labels:
        app: gpu-job
    spec:
      restartPolicy: Never
      containers:
      - name: cuda
        image: nvidia/cuda:13.3.0-base-ubi9
        command: ["/bin/sh", "-c", "echo gpu-job-3; nvidia-smi -L; sleep 30"]
        resources:
          limits:
            nvidia.com/gpu: 1
Apply all three at once and watch pod state:
kubectl apply -f gpu-jobs.yaml
kubectl get pods -l app=gpu-job
To watch live until all three finish:
kubectl get pods -l app=gpu-job -w
Immediately after submission:
gpu-job-1-c2ftc Running
gpu-job-2-l8q46 Running
gpu-job-3-cq2gs Pending ← no GPU available
The scheduler placed jobs 1 and 2 (consuming both GPU slots). Job 3 stays
Pending - not because it’s broken, but because the resource quota is
exhausted. This is the GPU equivalent of CPU resource contention.
After 30 seconds (jobs 1 & 2 complete, freeing their slots):
gpu-job-1-c2ftc Completed
gpu-job-2-l8q46 Completed
gpu-job-3-cq2gs Running ← scheduled now that capacity is free
All three ultimately ran and printed the same GPU UUID - confirming they all shared the single physical card, just not at the same time beyond the replica limit.
Key points#
- Resource-aware scheduling: the Kubernetes scheduler treats
nvidia.com/gpuexactly like CPU or memory - if no allocatable units remain, pods queue. - Why utilization monitoring matters: if Job 3 stayed Pending for hours in production, DCGM showing 20% GPU utilization on running pods would tell you the GPU is underutilized but oversubscribed - a signal to increase time-slicing replicas or optimize existing workloads.
- Contrast with Slurm (study guide reading): Slurm uses a job queue with priority and preemption; Kubernetes uses pending pods and priority classes. The underlying principle - finite GPU resources require a scheduler - is the same. Being able to articulate this, with a real example of a Pending pod, is the operational lesson here.
Lab 10: Pod Priority and Preemption#
Lab 9 showed jobs queuing when GPUs run out. The other half of scheduling is priority and preemption - when an important workload needs a GPU that a less-important one is holding, the scheduler can evict the latter. This is the Kubernetes equivalent of Slurm’s job priority and preemption.
Setup: one schedulable GPU#
Preemption is easiest to see when capacity = 1 - one pod can hold the only
slot. After Lab 9, drop the sharing.timeSlicing block entirely so the device
plugin reports the physical GPU count instead of a slicing config:
# time-slicing-config-1.yaml
apiVersion: v1
kind: ConfigMap
metadata:
  name: time-slicing-config
  namespace: gpu-operator
data:
  any: |-
    version: v1
    flags:
      migStrategy: none
Don’t set
replicas: 1. The device plugin’s config schema requiressharing.timeSlicing.resources[].replicasto be 2 or greater -replicas: 1fails to parse and crash-loops the plugin container:error parsing config file: ... number of replicas must be >= 2. With nosharingblock at all, the plugin falls back to reporting the one physical GPU, which is exactly the capacity this lab needs.
kubectl delete -f gpu-jobs.yaml --ignore-not-found
kubectl apply -f time-slicing-config-1.yaml
kubectl rollout restart daemonset nvidia-device-plugin-daemonset -n gpu-operator
kubectl rollout status daemonset nvidia-device-plugin-daemonset -n gpu-operator
kubectl get node kind-control-plane -o jsonpath='{.status.capacity.nvidia\.com/gpu}{"\n"}'
Expected: 1.
Step 1: Create PriorityClasses (cluster-scoped)#
# gpu-priority-classes.yaml
apiVersion: scheduling.k8s.io/v1
kind: PriorityClass
metadata:
  name: low-priority-gpu
value: 100
globalDefault: false
description: Best-effort GPU workloads
---
apiVersion: scheduling.k8s.io/v1
kind: PriorityClass
metadata:
  name: high-priority-gpu
value: 1000
globalDefault: false
preemptionPolicy: PreemptLowerPriority
description: Production GPU workloads
kubectl apply -f gpu-priority-classes.yaml
kubectl get priorityclass low-priority-gpu high-priority-gpu
Both classes register, each with its PreemptLowerPriority policy:
NAME                VALUE   GLOBAL-DEFAULT   AGE   PREEMPTIONPOLICY
low-priority-gpu    100     false            9s    PreemptLowerPriority
high-priority-gpu   1000    false            9s    PreemptLowerPriority
PriorityClass is cluster-scoped - no namespace. It lives at the cluster
level, like StorageClass or ClusterRole.
Step 2: Deploy the low-priority pod first#
# gpu-priority-low.yaml
apiVersion: v1
kind: Pod
metadata:
  name: low-prio-job
  labels:
    app: gpu-priority-demo
spec:
  priorityClassName: low-priority-gpu
  restartPolicy: Never
  containers:
  - name: cuda
    image: nvidia/cuda:13.3.0-base-ubi9
    command: ["sleep", "infinity"]
    resources:
      limits:
        nvidia.com/gpu: 1
kubectl apply -f gpu-priority-low.yaml
kubectl wait --for=condition=Ready pod/low-prio-job --timeout=120s
kubectl get pod low-prio-job
Expected: Running - it holds the only GPU.
Step 3: Deploy the high-priority pod#
# gpu-priority-high.yaml
apiVersion: v1
kind: Pod
metadata:
  name: high-prio-job
  labels:
    app: gpu-priority-demo
spec:
  priorityClassName: high-priority-gpu
  restartPolicy: Never
  containers:
  - name: cuda
    image: nvidia/cuda:13.3.0-base-ubi9
    command: ["/bin/sh", "-c", "echo HIGH priority running; nvidia-smi -L; sleep 60"]
    resources:
      limits:
        nvidia.com/gpu: 1
kubectl apply -f gpu-priority-high.yaml
kubectl get pod -l app=gpu-priority-demo -w
What to expect#
Real output from this lab:
pod/high-prio-job created
NAME            READY   STATUS              RESTARTS   AGE
high-prio-job   0/1     Pending             0          1s
low-prio-job    1/1     Terminating         0          46s
low-prio-job    0/1     Error               0          76s
high-prio-job   0/1     Pending             0          31s
high-prio-job   0/1     ContainerCreating   0          31s
low-prio-job    0/1     Error               0          76s
low-prio-job    0/1     Error               0          76s
low-prio-job    0/1     Error               0          76s
high-prio-job   0/1     ContainerCreating   0          31s
high-prio-job   1/1     Running             0          31s
high-prio-job   0/1     Completed           0          92s
high-prio-job   0/1     Completed           0          93s
low-prio-job goes straight from Terminating to Error - the preemption
kills the container mid-sleep, and with restartPolicy: Never the pod stays
around in Error state instead of disappearing (the repeated Error lines are
duplicate watch events, not retries). high-prio-job sits Pending until the
GPU frees up, then moves through ContainerCreating to Running about 30
seconds after being created, and finally to Completed once its sleep 60
finishes and the container exits cleanly. The scheduler preempted the
low-priority pod to make room. Confirm in events:
kubectl describe pod high-prio-job | tail -15
QoS Class:                   BestEffort
Node-Selectors:              <none>
Tolerations:                 node.kubernetes.io/not-ready:NoExecute op=Exists for 300s
                              node.kubernetes.io/unreachable:NoExecute op=Exists for 300s
Events:
  Type     Reason            Age    From               Message
  ----     ------            ----   ----               -------
  Warning  FailedScheduling  3m15s  default-scheduler  0/1 nodes are available: 1 Insufficient nvidia.com/gpu.
  Normal   Scheduled         2m44s  default-scheduler  Successfully assigned default/high-prio-job to kind-control-plane
  Normal   Pulled            2m44s  kubelet            spec.containers{cuda}: Container image "nvidia/cuda:13.3.0-base-ubi9" already present on machine and can be accessed by the pod
  Normal   Created           2m44s  kubelet            spec.containers{cuda}: Container created
  Normal   Started           2m44s  kubelet            spec.containers{cuda}: Container started
The FailedScheduling event is the scheduler’s own confirmation of why
high-prio-job waited - Insufficient nvidia.com/gpu - before the GPU freed up
and it got Scheduled. That single Insufficient warning, followed directly by
a successful Scheduled, is the preemption in a nutshell: no GPU, then a GPU,
with the low-priority pod’s removal in between.
And the high-priority pod then acquired the GPU:
kubectl logs high-prio-job
HIGH priority running
GPU 0: NVIDIA GeForce RTX 2080 (UUID: GPU-42ade211-...)
Cleanup (Lab 10 only)#
kubectl delete -f gpu-priority-high.yaml --ignore-not-found
kubectl delete -f gpu-priority-low.yaml --ignore-not-found
kubectl delete -f gpu-priority-classes.yaml --ignore-not-found
Key points#
- Priority + preemption is how shared GPU clusters guarantee that critical jobs (production inference, deadline training) get resources over best-effort work (experiments, batch analytics).
- Contrast with queuing (Lab 9): queuing waits for voluntary release; preemption forcibly reclaims. Slurm offers both via partitions and QOS; Kubernetes offers both via PriorityClasses and pod priority.
- The operational lesson: preemptible workloads should checkpoint their progress, because they can be killed at any time - a key design consideration for production AI operations.
Lab 11: CUDA Profiling with Nsight Systems#
Comparing GPU and CPU architectures is best understood by looking at what a GPU
actually does during a workload. Nsight Systems (nsys) is NVIDIA’s
system-wide profiler; it’s bundled in the TensorRT and CUDA containers.
Profiling a real workload#
nsys is not installed on the WSL host - it ships inside the TensorRT NGC
container (nvcr.io/nvidia/tensorrt), the same image Lab 8 used. And the ONNX
model lives on the Kind node at /models/densenet_onnx/1/model.onnx.
So run the profiler inside a GPU pod that mounts the same
hostPath volume as Triton.
The pod runs nsys profile on a trtexec inference run (200 iterations), then
nsys stats on the resulting report. Tracing needs the SYS_ADMIN capability:
# nsys-profile.yaml
apiVersion: v1
kind: Pod
metadata:
  name: nsys-profile
spec:
  restartPolicy: Never
  containers:
  - name: nsys
    image: nvcr.io/nvidia/tensorrt:26.05-py3
    command: ["/bin/sh", "-c"]
    args:
    - |
      nsys profile --trace=cuda,cudnn,osrt --output=/tmp/trt_profile \
        trtexec --onnx=/models/densenet_onnx/1/model.onnx --iterations=200 --warmUp=50
      nsys stats --report cuda_api_sum /tmp/trt_profile.nsys-rep
      nsys stats --report cuda_gpu_kern_sum /tmp/trt_profile.nsys-rep
    securityContext:
      capabilities:
        add: ["SYS_ADMIN"]
    resources:
      limits:
        nvidia.com/gpu: 1
    volumeMounts:
    - name: models
      mountPath: /models
  volumes:
  - name: models
    hostPath: { path: /models, type: Directory }
kubectl delete pod nsys-profile --ignore-not-found   # pods are immutable; clear any prior run
kubectl apply -f nsys-profile.yaml
kubectl wait --for=jsonpath='{.status.phase}'=Succeeded pod/nsys-profile --timeout=600s
kubectl logs nsys-profile
Re-running? A
Podis immutable, sokubectl applyon an existingnsys-profilefails withpod updates may not change fields other than ...and leaves the old pod (and its old logs) in place. Alwayskubectl delete pod nsys-profilefirst, or you’ll be reading stale output from the previous run.
If you have the TensorRT image locally and prefer Docker, the equivalent one-off run is:
docker run --rm --gpus all --cap-add=SYS_ADMIN \
  -v /models:/models nvcr.io/nvidia/tensorrt:26.05-py3 sh -c \
  'nsys profile --trace=cuda,cudnn,osrt --output=/tmp/trt_profile \
     trtexec --onnx=/models/densenet_onnx/1/model.onnx --iterations=200 --warmUp=50 && \
   nsys stats --report cuda_api_sum /tmp/trt_profile.nsys-rep'
Note the
/modelspath only exists inside the Kind node, so the pod form above is the one that matches this lab’s setup.
The CUDA API timeline#
nsys stats --report cuda_api_sum prints the CUDA API calls the host made,
ranked by total time. The top entries from this lab (lower-weight calls omitted):
** CUDA API Summary (cuda_api_sum):

 Time (%)  Total Time (ns)  Num Calls   Avg (ns)     Med (ns)    Min (ns)   Max (ns)     Name
 --------  ---------------  ---------  -----------  -----------  ---------  ---------  -----------------------
 30.4      15767213228        89795     175591.2      94000.0        499    7803777    cudaEventSynchronize
 11.6       6010402774       375036      16026.2       9500.0       5300   21686635    cudaLaunchKernel
  9.1       4704683378       275890      17052.8       9100.0       4499    3177291    cuLaunchKernelEx
  8.5       4382835547       309473      14162.3       8500.0        100    5020585    cudaMemsetAsync
  6.9       3570240355        58920      60594.7        700.0        300    2583992    cudaFree
  6.4       3317668188         4172     795222.5     546198.0     337099    3872988    cuModuleLoadData
  5.7       2938251428        58986      49812.7      25300.0        600    1942494    cudaStreamSynchronize
  5.1       2646867687         7571     349606.1     426999.0       1000   14898156    cudaMallocAsync
  4.6       2359882476         5257     448902.9     477798.0       2200   14160458    cudaMalloc
  4.5       2310918213       187277      12339.6       6400.0       3300    1542996    cudaEventRecord
  2.8       1430200428       113851      12562.0       7700.0       4699    1174096    cuLaunchKernel
This is the architectural story in the trace: the CPU (host) is busy
orchestrating - synchronizing on the GPU (cudaEventSynchronize, the single
biggest slice at 30.4%, where the host simply waits for the device to finish),
launching hundreds of thousands of kernels (cudaLaunchKernel +
cuLaunchKernelEx + cuLaunchKernel together account for well over 750k calls),
allocating memory (cudaMalloc/cudaMallocAsync), and loading modules
(cuModuleLoadData) - while the GPU does the parallel compute. That
cudaEventSynchronize tops the list is the key lesson: for this small,
memory-bound model the host spends most of its API time blocked waiting on the
device, not doing useful CPU work.
A real WSL limitation worth knowing#
The cuda_api_sum report above works fine because it only needs host-side CUDA
API data, which nsys captures on WSL. But ask for a GPU kernel report and
there’s nothing to summarize:
nsys stats --report cuda_gpu_kern_sum /tmp/trt_profile.nsys-rep
Processing [/tmp/trt_profile.sqlite] with [.../reports/cuda_gpu_kern_sum.py]...
SKIPPED: /tmp/trt_profile.sqlite does not contain CUDA kernel data.
WSL2’s paravirtualized GPU exposes the CUDA API (host side) to nsys but not the
device-level hardware counters needed for kernel-execution traces. NVIDIA’s CUDA
on WSL guide documents that developer profilers have limited/preview support in
WSL. On bare-metal Linux you’d get the full GPU timeline. This is exactly the
kind of environment-specific constraint an operations engineer must recognize -
and it’s why the report we can run (cuda_api_sum) is the one this lab builds on.
Key points#
- GPU vs. CPU work division: the API trace makes it concrete - CPU orchestrates, GPU executes thousands of parallel threads per kernel.
- Tool awareness:
nsys(timeline, system-wide) vs.ncu/Nsight Compute (per-kernel detail) vs. DCGM (production metrics). Know which tool answers which question. - WSL/virtualization constraints: profiling depth depends on the platform - especially relevant when GPUs are virtualized or paravirtualized.
Wrapping Up#
Together with Part 1, these labs cover monitoring, sharing, serving, and scheduling on a single-GPU home lab. The remaining topics (DPUs, InfiniBand, NVSwitch, DGX/SuperPOD reference designs, multi-node fabrics) need larger hardware - but walking in having watched power hit a 150 W cap under Ollama inference, shared one GPU across pods, run Triton, TensorRT, RAPIDS, and an LLM, profiled the CUDA API, broken and fixed the validation chain, and seen the scheduler queue and preempt jobs makes those concepts concrete rather than abstract.
References#
- NVIDIA DCGM and dcgm-exporter docs
- Monitoring GPUs in Kubernetes with DCGM , NVIDIA Technical Blog
- Time-Slicing GPUs in Kubernetes , NVIDIA GPU Operator docs
- NVIDIA Multi-Instance GPU (MIG)
- NVIDIA Dynamo-Triton (formerly Triton Inference Server), NVIDIA Developer
- Triton quickstart
(model repo, launch, health check,
image_client) - Triton Inference Server documentation
- NVIDIA TensorRT and TensorRT Developer Guide
- nvidia-smi documentation
- NVIDIA Nsight Systems
- NVIDIA NGC Catalog and NGC overview
- RAPIDS
- Kubernetes Pod Priority and Preemption
- Slurm Workload Manager
- GPU Operator Architecture and Validation
- CUDA on WSL User Guide
- NCA-AIIO certification
- NCA-AIIO Exam Study Guide (PDF)